The Simplest Monte Carlo Simulation (Coin Betting Game)
Suppose we are playing a game in which a player receives \$1 if a coint toss is head and loses \$1 if the coin toss is tails.I will denote the loss as -$1. The player would like to know his or her winning or losses after a certain number of trials. For each trial, we sample 1 or -1 then sum the outcomes across the total trials to get the final win.
# A function that samples 1 or -1 n number of times
bet <- function(n = 50) {
  win <- sample(c(-1, 1), size = n, replace = TRUE)
  sum(win)
}

# If we bet 100 times, what is our winning?
bet(100)  # This of course will be different each time you run the function
## [1] -12
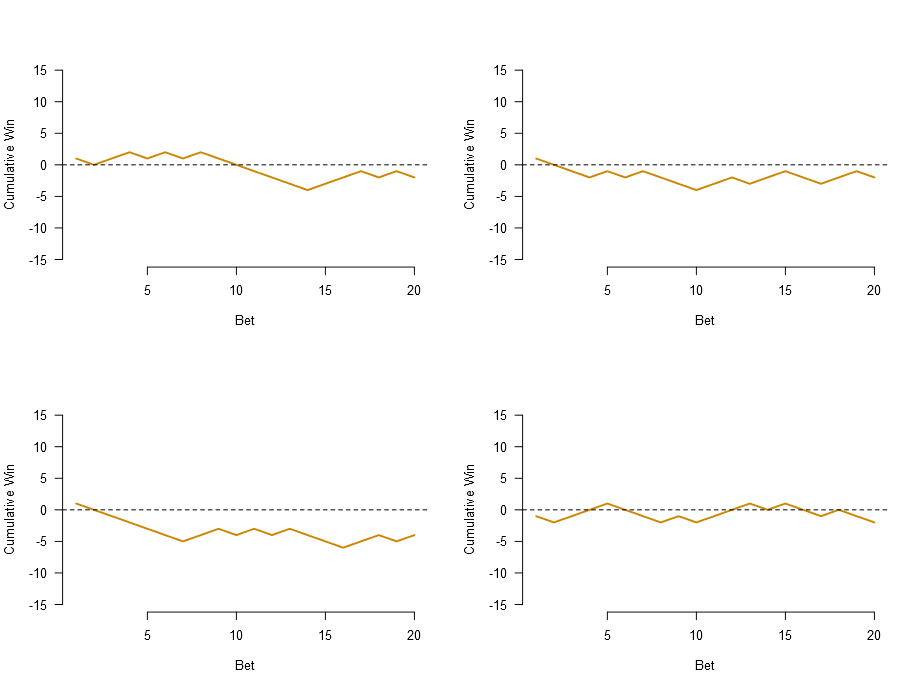
We can plot the different paths indicating the cumulative wins at each trial.
par(mfrow = c(2, 2), bty = "n")
for (i in 1:4) {
  win <- sample(c(-1, 1), size = 20, replace = T)
  plot(cumsum(win), type = "l", col = c("orange3"), ylim = c(-15, 15),
       lwd = 2, xlab = "Bet", ylab = "Cumulative Win", las = 1
  )
  abline(h = 0, lty = "dashed")
}
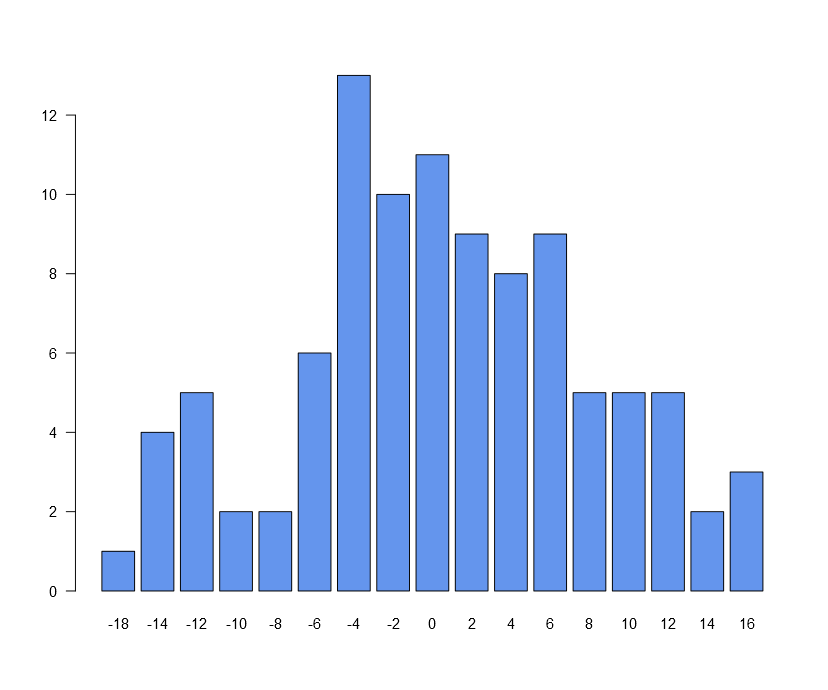
Now would like to know generate a table to display our overal winnings if we run the function bet 100 times and determine what are the most likes wins. Then we can plot the distribution of the winnings. Notice: The distributions will change each time you run the code.
win.rep <- replicate(100, bet())
table(win.rep)
## win.rep
## -20 -18 -14 -12 -10  -8  -6  -4  -2   0   2   4   6   8  10  12
##   1   2   1   3   2   4  10  14  12   8  10  11   6  10   3   3
barplot(table(win.rep), col = "cornflowerblue", las = 1) # Notice the color name
Shiny App
I wanted to create an interactive app that lets users play around with this simulation game to see how they fair in their betting. So I created an app which you can find here.